Genius is a graphical software tool for visualizing genetic networks composed by a high number of genes. It accepts as input a matrix summarizing gene relationships inferred by means of reverse engineering methods. Genius offers two visualization modalities (the Agorà style and the TouchGraph style), that can be exploited in a complementary way. It is thus possible to obtain a clear and easily customizable view of one or more networks of interest which allows to simplify the exploration of the inferred relationships.
How does it work?
It is a graphical software tool for visualizing genetic networks composed by a high number of genes. It accepts as input a matrix summarizing gene relationships inferred by means of reverse engineering methods.
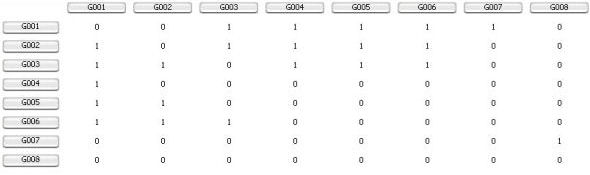
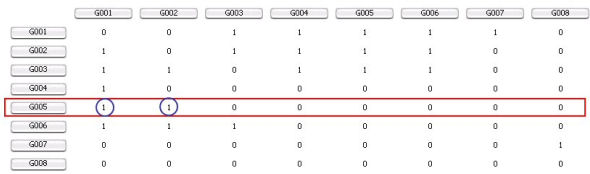
Data are organized by row, thus, the gene "G005" influences the genes: "G001" and "G002".
These oriented relations are depicted through two different kind of graphs:
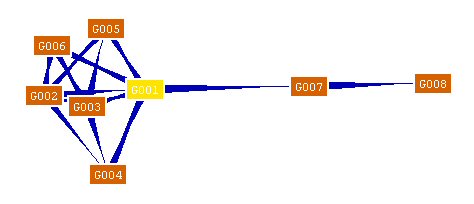
1) The next graph comes from an idea of Stefano Mazzocchi. It was originally used for visualization of virtual community through a run-time interactive molecular-style simulation. For more details on the implemented model, visit the web site of the project (Agorà).
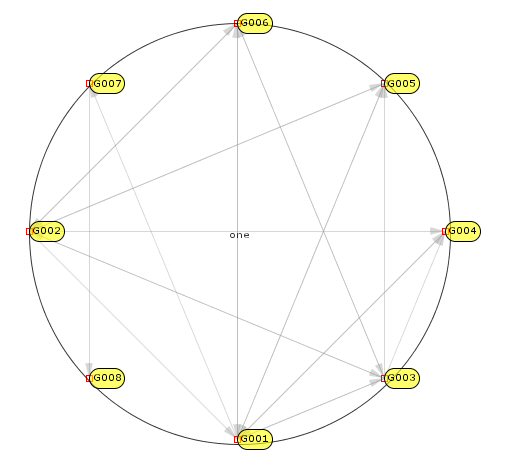
After a simulation, we will obtain the following layout:
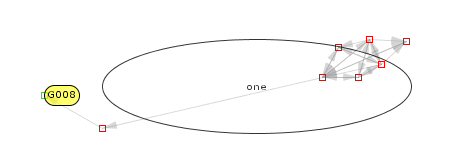
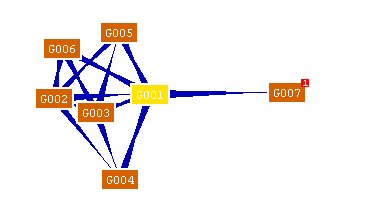
2) The second kind of graph is based on TouchGraph and is more oriented to show influences of a particular gene (the yellow one). In the following picture are depicted first level influences:
Depicting second level influences too:
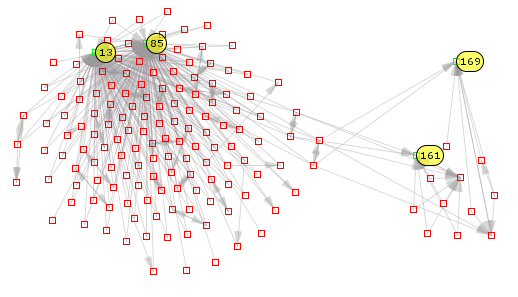
Complex Example
The entire network inferred from the serum response data as displayed after the automatic process which rearranges nodes according to their force of attraction/repulsion. Nodes whose label is highlighted are the so called "hubs", that is the most highly connected pseudo-genes (indicated with the numbers 13, 85, 161, 169).
Present and future of Genius
Genius was born as prototype and was presented in IDAMAP 2004 (paper). After that Stefano and I focused on Welkin a graph-based RDF visualizer (read more about Agorà, Genius and Welkin history on Stefano's blog). Since March 2010 the code is available in google code and this is how Genius looks like on 16th April 2010:


References
[1] Paolo Ciccarese, Stefano Mazzocchi, Fulvia Ferrazzi, Lucia Sacchi. Genius: a new tool for gene networks visualization. IDAMAP (Intelligent Data Analysis in Medicine & Pharmacology) 2006 Proceedings, ed Blaz Zupan, John H. Holmes, pag. 107 - 111. Presented in Stanford, USA on Sep 6, 2004